Screenshots of Working with Sviss
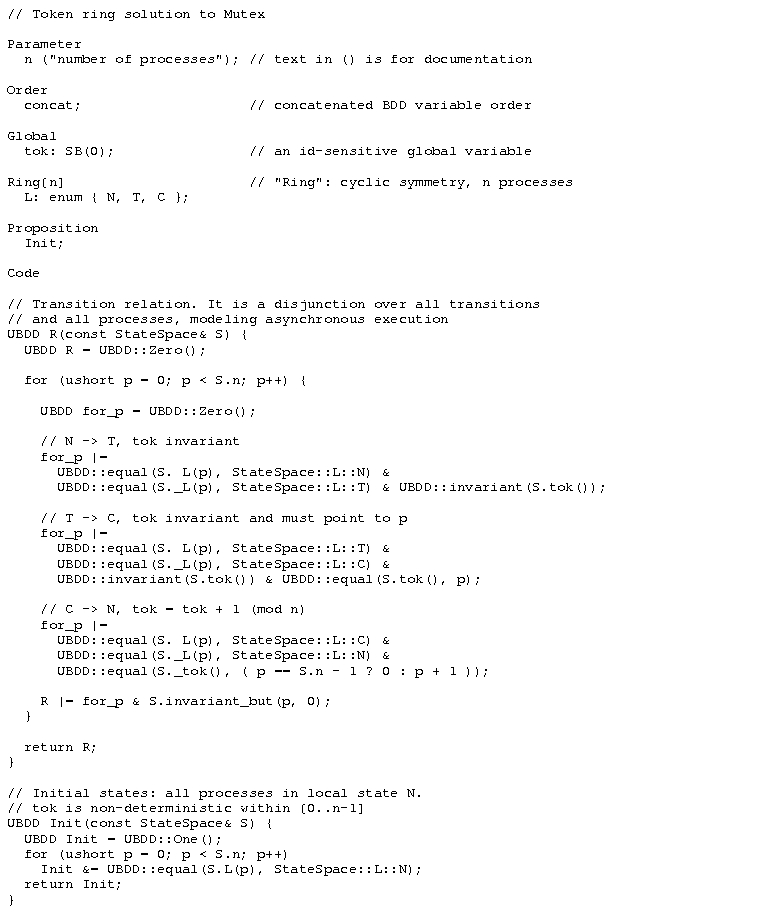
Example of a system specification in Sviss:
The following file describes a simple
token-ring mutual exclusion protocol in Sviss. A process can move from
the trying region T to the critical section C only if the global
variable tok points to
(contains the index of) this process. After leaving C, the process
passes the token on to the next process. The resulting Kripke
structure has cyclic symmetry, which is indicated by the user using the
keyword Ring below.
The text before the keyword Code declares parameters, the BDD
variable order to be used (concat
means that all variables of
process 1 appear first, then all variables of process 2, and so on. An
alternative is interleaved
variable order), further global
variables, local variables (following the Ring keyword) and atomic
propositions. The text after the keyword Code defines, using the
modeling library, the transition relation and the set of initial states.
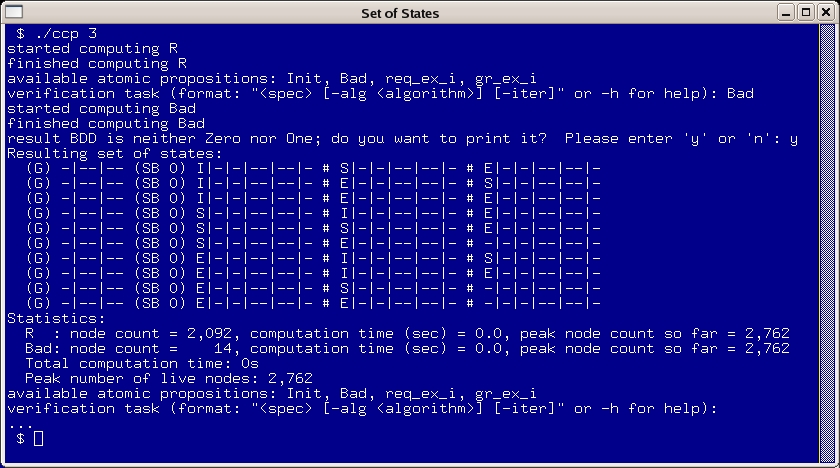
Printing a set of states compactly:
In the following example, a
parameterized cache coherence protocol (called ccp) is instantiated with 3
processes. In the line verification
task, Sviss asks for a specification, which in this case was
entered as just an atomic proposition, Bad. The set of Bad states is defined in the model
as the set of global states where one process is in the "exclusive"
cache state E, while another
process is not in the
"invalid" cache state I, i.e.
in E or S (shared). Since this set is not
empty, the user has the choice of viewing it, which results in the
chart below. (G) announces
the values of global variables, (SB
0) the variables of the first and only symmetry block, i.e. the
local variables of the processes. The hash mark # separates processes,
the vertical bar | separates
individual program variables, a dash -
represents don't care values.
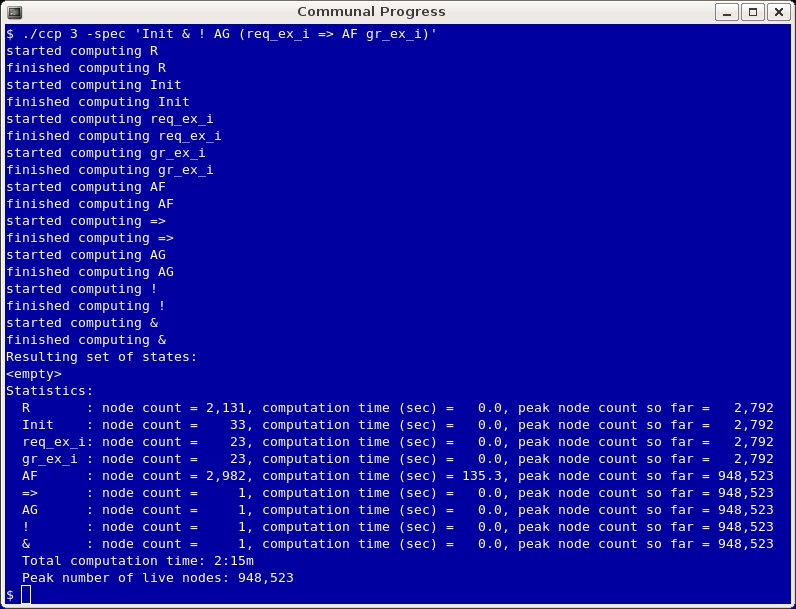
Verifying communal progress and printing some
statistics:
In the example below, a specification
was entered directly as part of the command line (rather than at a
prompt). The tool communicates what is currently being computed and
responds that the resulting set of states is empty, which means that
there is no initial state violating the AG property. The tool then prints
statistics on how large each intermediate BDD was, how much time it
took to compute it, and what the maximum number of BDD nodes allocated
at each stage was. Finally, the tool reports cumulative numbers for
computation time and BDD nodes allocated.
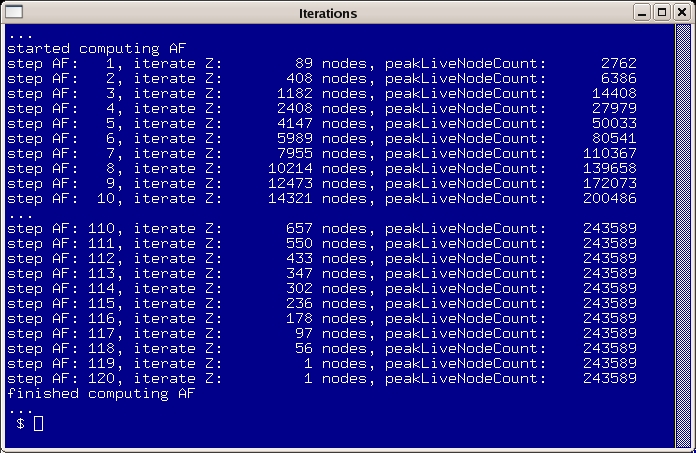
Printing information about fixpoint
iterations during
model checking:
Using the -iter flag, the user can request
more information about intermediate stages of the computation,
mainly for expressions involving fixpoints. The tool then displays
the step count and, for each step, the current size of the BDD being
computed and the maximum number of nodes allocated up to that point.
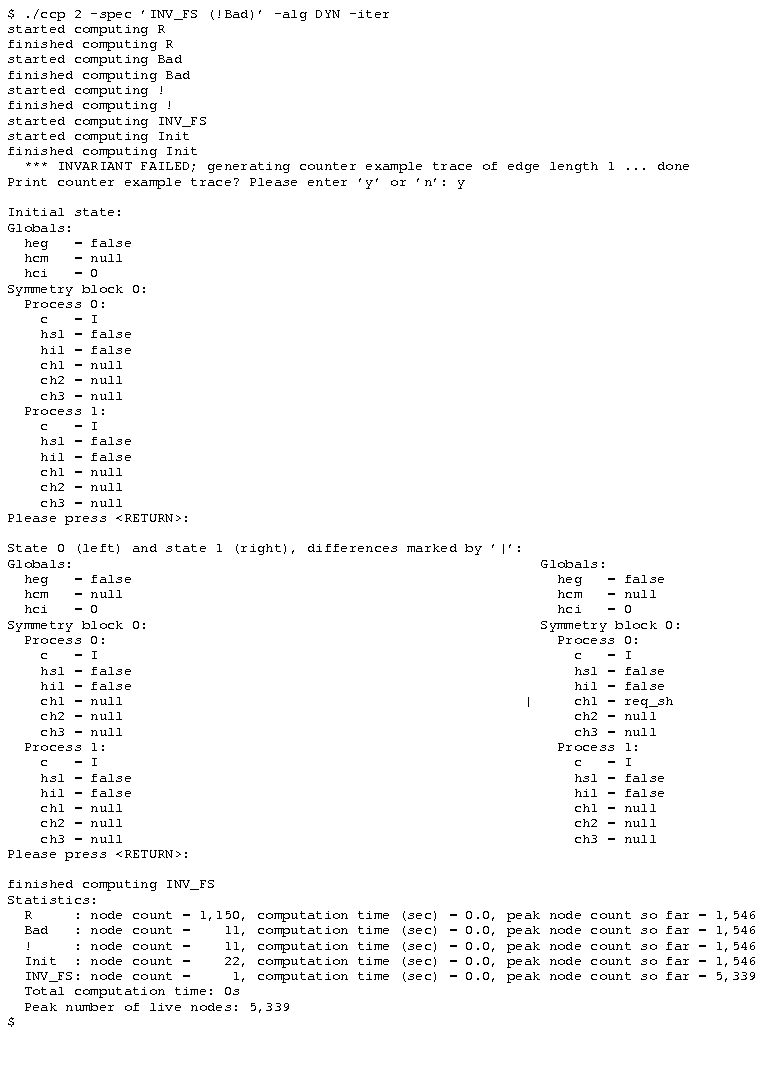
Error trace for failed invariant proof:
In the example below, the cache
coherence protocol from above is instantiated with 2 processes. In
order to provoke a short counter example, we
check the bogus claim that no process can ever request shared access
to the resource. After
printing the initial state, every transition (here: only one) is shown
as the current state to the left of the
successor state; changes in variables are marked with a vertical bar |
next to the variable: