
Contents
Manual
I. Overview of the tool
The tool instruments programs such that they can be verified for different weak memory models (WMMs) with a model-checker verifying sequentially consistent (SC) programs. It also provides some visualisations of the WMM violation cycles the program might encounter, a list of them and their references, and a list of idioms to relate the program to some simpler, already known examples.
The objectives of this tool are manyfold:
- given a WMM, instrumenting efficiently a program, to detect some bugs related to WMM with an SC model-cheker;
- supporting real C code, and instrumenting for several architectures (currently, TSO, PSO, RMO, a fragment of Power);
- helping the debugging with the support of several fences in the instrumentation;
- assisting the debugger, by providing a clear visualisation of the potentially unsafe events on shared variables (and their locations in the code);
- providing a list of small concurrent idioms corresponding to the detected cycles, and their fixes.
II. How to install it?
You can download x86_64 binaries of goto-cc and the modified goto-instrument, and the Perl script for detecting matching idioms below:You can download a model-checker for concurrent programs from its link:
The source of goto-cc and goto-instrument can be found below:
To compile goto-instrument, you will need glpk (for the computation of pairs to instrument with minimum interference), pthreads (for the parallel computation of cycles in the SCCs), and optionally a SAT/SMT solver for the cycle reduction option (see CBMC documentation). In the src folder, once config.inc is edited, use make cbmc.dir; make goto-cc.dir; make goto-instrument.dir to compile the binaries.
III. How to use it?
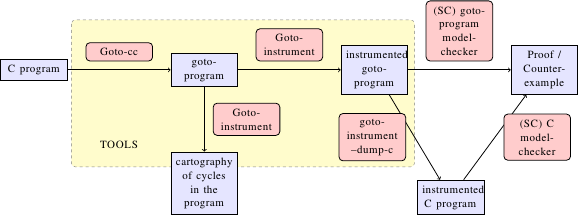
The tool is built with the CProver framework (http://www.cprover.org/). The C program is first turned into a goto-program using goto-cc -- a representation of the program common to the tools of this framework. It is then instrumented by goto-instrument, by adding some instructions to relevant places to simulate the WMM. A model-checker can finally check the program, directly from the goto-program (Satabs, CBMC-MT), or after having dumped C code from the instrumented goto-program with goto-instrument --dump-c (ESBMC, Threader, Poirot, MMChecker, Checkfence).
1) goto-cc
This program turns a program C into a goto-program. For additional information, please read the goto-cc's website.
Usage:
goto-cc -o my_prog.goto my_prog.c2) goto-instrument
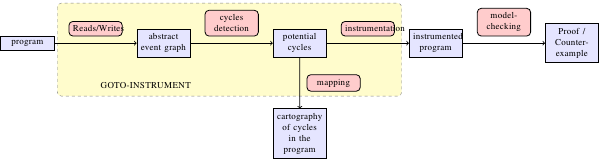
goto-instrument instruments a goto-program. It also generates three files:(a) cycles.dot, a visual representation of the potentially dangerous cycles in the program. You can convert it to a picture, using for instance dot (e.g., dot -Tpng < cycles.dot > cycles.png). The graph obtained should look like the one below.
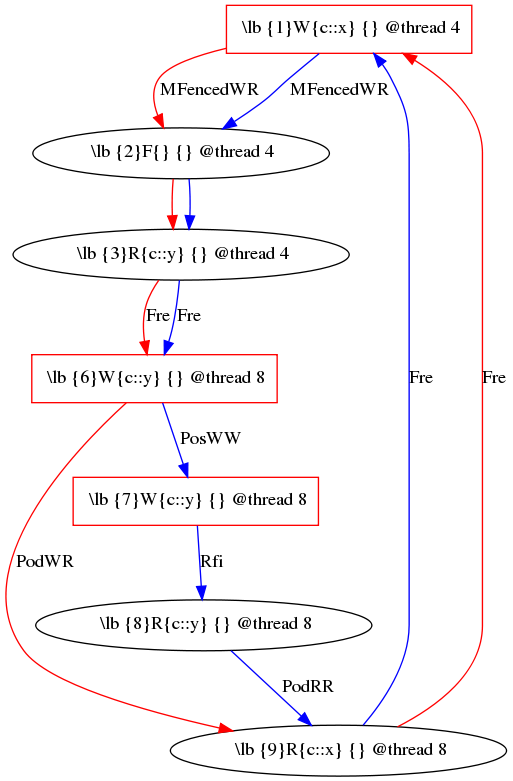
The red boxes represent the variables instrumented. A vertex is an event for a variable at a given line of the original code, and an edge between two vertices an order between those two events. The first number is the identifier of the events, that you can use when targetting specifically some events for instrumenting.
(b) ref.txt, the list of cycles instrumented. This file lists the names of all the cycles detected in the program, with the Diy notation:
PodRR Fre PodWW Rfe
PodRW Rfe PodRW Rfi PodRW Rfe
PodRW Rfe PodRW Rfi PodRW Rfe
PodRW Rfi PodRW Rfe PodRW Rfi PodRW Rfe
PodRW Rfi PodRW Rfe PodRW Rfi PodRW Rfe
PodRW Rfi PodRW Rfe PodRW Rfi PodRW Rfe
PodRW Rfi PodRW Rfe PodRW Rfe
PodRW Rfi PodRW Rfe PodRW Rfe
PodRW Rfe PodRW Rfi PodRW Rfe
PodRW Rfe PodRW Rfi PodRW Rfe
PodRW Rfi PodRW Rfe PodRW Rfi PodRW Rfe
PodRW Rfi PodRW Rfe PodRW Rfi PodRW Rfe
PodRW Rfi PodRW Rfe PodRW Rfi PodRW Rfe
PodRW Rfi PodRW Rfe PodRW Rfe
PodRW Rfi PodRW Rfe PodRW Rfe
(c) output.txt, the list of cycles with their locations in the code.
c::anchor_g (file work_stealing_dequeue.c line 37 function put) c::anchor_g (file work_stealing_dequeue.c line 87 function steal) c::steal::1::task (file work_stealing_dequeue.c line 92 function steal) c::steal::1::task (file work_stealing_dequeue.c line 93 function steal) c::anchor_g (file work_stealing_dequeue.c line 96 function steal) c::anchor_g (file work_stealing_dequeue.c line 26 function put)
Here are the options that we have implemented for the instrumentation:
2.1) detection option
--wmm arch: instruments an SC program so that it behaves on SC as if it were executed on the architecture arch (among tso, pso, rmo and power)
Usage:
goto-instrument --wmm {arch} my_prog.goto my_prog_inst.goto2.2) instrumentation options
By default, the tool instruments all the unsafe pairs in the critical cycles.(e) --one-event-per-cycle: only instruments one (arbitrary) pair per cycle (sound)
Usage:
goto-instrument --one-event-per-cycle --{archi} my_prog.goto my_prog_power.goto(f) --minimum-interference: only instruments one pair per cycle, choosing them with minimising a cost function (sound)
Usage:
goto-instrument --minimum-interference --{archi} my_prog.goto my_prog_power.goto(g) --my-events: only instruments the events whose identifiers appear in inst.evt (potentially unsound). The identifiers are the integers appearing in the vertices on the dot graph. The inst.evt file is taking a first integer, the number of events to instrument, and the identifiers of the events to instrument.
For instance, on the graph above, I just want to instrument the write to y in thread 8 (id: 6) and the write to x in thread 4 (id 1). inst.evt would be:
2 6 1
Note that if you want to instrument an Rfe pair, you need to instrument both events.
Usage:
goto-instrument --my-events --{archi} my_prog.goto my_prog_power.goto2.3) computation options
(h) --no-dependencies: disables the dependencies analysis
Usage:
goto-instrument --{archi} --no-dependencies my_prog.goto my_prog_power.goto(i) --scc: detection of cycles in parallel -- one SCC per thread
Usage:
goto-instrument --scc --{archi} my_prog.goto my_prog_power.gotoNote that if goto-instrument is not compiled with #define DISTRIBUTED, the --scc option treats the SCCs sequentially.
(j) --cfg-kill: enables symbolic execution used to reduce spurious cycles
Usage:
goto-instrument --cfg-kill --{archi} my_prog.goto my_prog_power.goto(k) --max-var <n>: maximum number of shared variables appearing in a cycle. Default value is the maximum number of interferring threads (upperbound, sound).
Usage:
goto-instrument --max-var N --{archi} my_prog.goto my_prog_power.goto(l) --max-po-trans <n>: maximum number of transitions by po (in the computation of an edge in po+) allowed. By default, there is no maximum (sound).
Usage:
goto-instrument --max-po-trans N --{archi} my_prog.goto my_prog_power.goto2.4) rendering options
(m) --no-po-rendering: abstract events on the same thread are represented on the same row. Dot cannot always handle very large graph with these constraints; this option relaxes them.
Usage:
goto-instrument --no-po-rendering --{archi} my_prog.goto my_prog_power.goto(n) --render-cluster-file: clusters nodes in the graph per files. Not compatible with --render-cluster-function
Usage:
goto-instrument --render-cluster-file --{archi} my_prog.goto my_prog_power.goto(o) --render-cluster-function: clusters nodes in the graph per functions. Not compatible with --render-cluster-file
Usage:
goto-instrument --render-cluster-function --{archi} my_prog.goto my_prog_power.goto3) model-checkers
3.1) directly reading from goto-programs
We directly apply the model-checker to the instrumented goto-program. Goto-instrument adds additional assertions in the program to ensure the buffers are never overflowed. If CBMC/Satabs returns a counter-example violating one of these assertions, you can look at the assertions you want to reach (use cbmc-mt/satabs --show-claims my_prog_instr.goto), and target them specifically (cbmc-mt/satabs --claim thr1.1 my_prog.goto, for instance).CBMC-MT:
Usage:
cbmc-mt my_prog.gotoSatabs: Use Satabs with the concurrency option and the maximum number of threads N in the program. Please use the last version of Satabs.
Usage:
satabs --concurrency --full-inlining --max-threads N --model-checker boom my_prog.goto
3.2) reading from C sources
We first dump the instrumented program into a C program, and then apply a model-checker.Checkfence:
Usage:
goto-instrument --dump-c my_prog_inst.goto my_prog_inst.c

./checkfence.sh log
ESBMC:
Usage:
goto-instrument --dump-c my_prog_inst.goto my_prog_inst.c

esbmc -Dfalse=0 -Dtrue=1 -Dassume=__ESBMC_assume -D__CPROVER_atomic_begin=__ESBMC_atomic_begin -D__CPROVER_atomic_end=__ESBMC_atomic_end --unwind 7  --no-unwinding-assertions --state-hashing my_prog_inst.c
MMChecker: Use the script in the same folder as Threader's binary, or modify the path
path in the script. Update the path path_ildasm with the path of ildasm.exe.
Usage:
goto-instrument --dump-c my_prog_inst.goto my_prog_inst.c

./mmchecker.sh log my_prog_inst.c
Poirot: Use the script in the Poirot's folder, or modify the path
POIROT_ROOT in the script. If you use the Microsoft Visual Studio prompt, uncomment the lines in the script as explained in the file.
Usage:
goto-instrument --dump-c my_prog_inst.goto my_prog_inst.c

./poirot.sh log my_prog_inst.c
Threader: Use the script in the same folder as Threader's binary, or modify the path
check_path in the script.
Usage:
goto-instrument --dump-c my_prog_inst.goto my_prog_inst.c

./threader.sh log my_prog_inst.c
To experiment the different modes of Threader, add in the last line one of the next options:
--algorithm:monolithic
--algorithm:owicki-gries
--algorithm:rely-guarantee
--algorithm:owicki-gries
--algorithm:rely-guarantee
4) cycle-matcher
This script relates detected cycles to existing WMM idioms. Cycles are presented as follows:
Cycle 1 is tests/x86/safe/safe022.litmus on locations c::tasks[] (file fifo_pt.c line 72 function steal) c::tasks[] (file fifo_pt.c line 27 function put) c::tail (file fifo_pt.c line 30 function put) c::tail (file fifo_pt.c line 68 function steal)
Usage:
cycle_matcher all_cycles ref.txt output.txt | grep ^Cycle5) example 1: checking a program for a given architecture
We want to check that a program (derived from this Litmus test) is safe for PSO (and then safe for TSO), but not for RMO (and for Power, by inclusion). We first convert the program into a goto-program:
goto-cc -o safe006.goto safe006.c
Then we instrument it for PSO:
goto-instrument --pso safe006.goto safe006_pso.goto
We check it with Satabs:
satabs --concurrency --full-inlining --max-threads 3 --model-checker boom safe006_pso.goto
And Satabs returns that the program is validated after 1.64 sec:
Statistics of modelchecker:
Broadcast assignment operations executed: 0
Non-broadcast assignment operations executed: 220
Time spent in broadcast assignment operations: 0
Time spent in non-broadcast assignment operations: 0.002453
VERIFICATION SUCCESSFUL
Broadcast assignment operations executed: 0
Non-broadcast assignment operations executed: 220
Time spent in broadcast assignment operations: 0
Time spent in non-broadcast assignment operations: 0.002453
VERIFICATION SUCCESSFUL
We have indeed two RW pairs, which cannot be reordered on PSO. We now investigate for RMO. We instrument with this weaker architecture, and check again with Satabs
goto-instrument --rmo safe006.goto safe006_rmo.goto
satabs --concurrency --full-inlining --max-threads 3 --model-checker boom safe006_rmo.goto
satabs --concurrency --full-inlining --max-threads 3 --model-checker boom safe006_rmo.goto
The model-checker returns after 7.14 sec this counter-example and a failure message below.
Violated property:
file safe006.c line 27 function main
assertion
$tmp_guard
VERIFICATION FAILED
file safe006.c line 27 function main
assertion
$tmp_guard
VERIFICATION FAILED
The two RW pairs can indeed be reordered under RMO, and the assertion can be violated.
6) example 2: identifying statically some potential WMM-related bugs in a program
Let us consider the same problem, that is, checking the validity of a program for PSO and stronger, but not for RMO and weaker. But, this time, we assume that we cannot use the model-checker. This happens often when the code to check is too large. goto-instrument can provide anyway some information and visualisations to help the debugger finding the risk/bug.We turn the program into a goto-program, and instrument it for PSO:
goto-cc -o safe006.goto safe006.c
goto-instrument --pso safe006.goto safe006_pso.goto
goto-instrument --pso safe006.goto safe006_pso.goto
goto-instrument do not detect any cycle: output.txt (list of cycles in the program), ref.txt (names of the cycles), cycles.dot (graph of the cycles and the instrumented events). There is nothing to instrument. Here, if the program is safe for SC, then it is safe for the weaker architecture as well.
We do the same for RMO:
goto-cc -o safe006.goto safe006.c
goto-instrument --rmo safe006.goto safe006_rmo.goto
goto-instrument --rmo safe006.goto safe006_rmo.goto
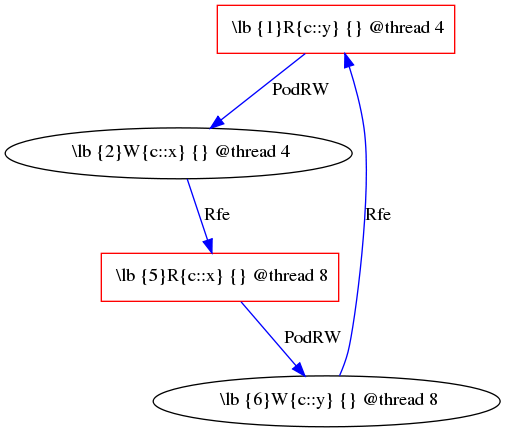
goto-instrument detects one potentially violating cycle: the PodRW Rfe PodRW Rfe (output.txt, ref.txt, cycles.dot). The picture reveals that both of the RW pairs are to be instrumented, since potentially unsafe. For large program, we may want to relate the cycles detected to some small, already known Litmus examples. We apply the script which tries to find some idioms in the detected cycle:
./cycle-matcher.pl all_cycles ref.txt output.txt | grep ^Cycle
The cycle matcher finds one idiom already known: the idiom x86/safe006.
Cycle 1 is tests/x86/safe/safe006.litmus on locations c::x (file safe006.c line 9 function P0) c::x (file safe006.c line 16 function P1) c::y (file safe006.c line 17 function P1) c::y (file safe006.c line 8 function P0)
We can then access the Litmus file of x86/safe006, and run the example to get a better insight of the bug in the main program.