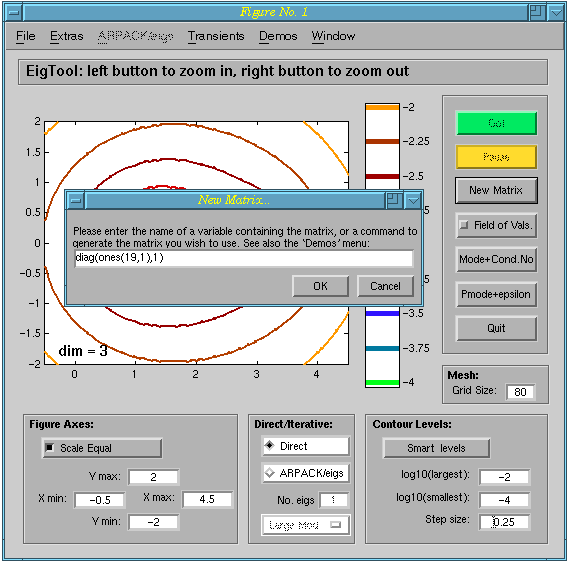
Field of Vals.
This example is based on the Kahan matrix in the Demos menu; the field of values is shown as a
dashed black line:
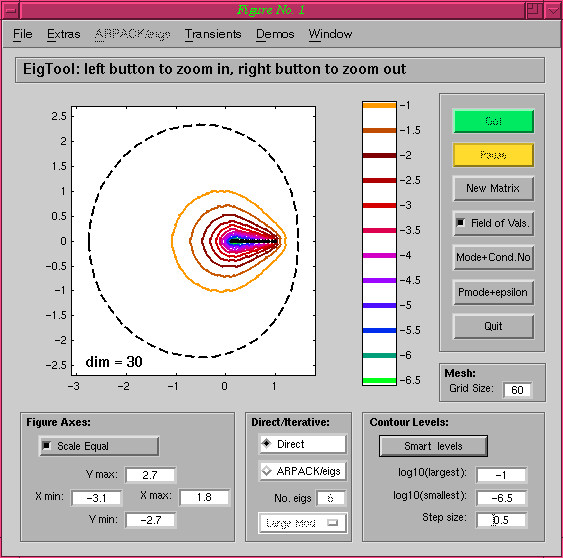
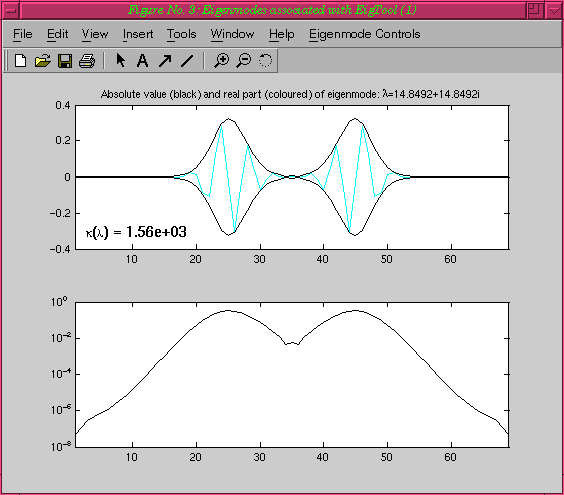
The corresponding eigenmode with its condition number is shown in this figure:
EigTool home page.
Mode + Cond. No.
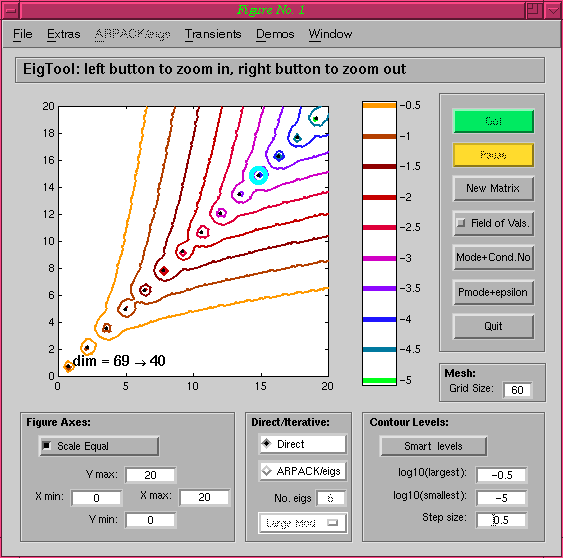
The figure below shows the eigenvalues and pseudospectra of Davies'
matrix, with the cyan circle indicating the eigenvalue selected after
clicking on Mode + Cond. No:
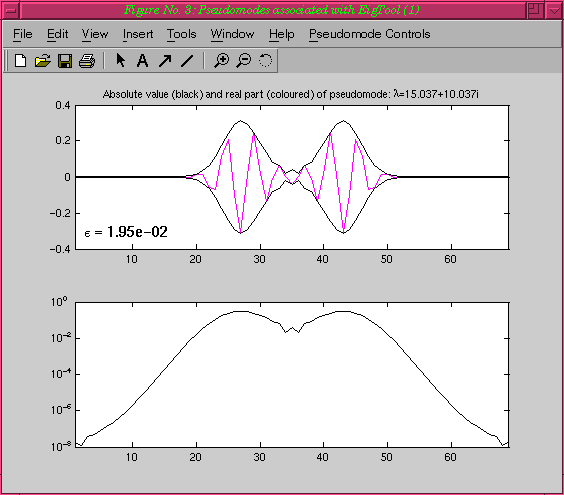
Pmode + epsilon
Using the same matrix as for Mode + Cond. No.,
we can plot a pseudomode corresponding to z=15+10i: