
Worksheet 6: Escher pictures
Let's see how to draw the Escher picture "Square Limit":
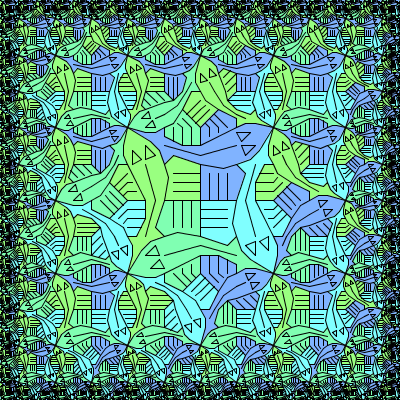
What is fascinating about this picture is that the fish get smaller and smaller as they get closer the the edge of the picture, making it possible in principle to draw an infinite number of fish in a finite space. Instead of drawing this infinitely complex picture, we will instead define a function that can produce any finite portion of it. At first, we'll aim at making a black-and-white version of the picture.
The picture is made from four square tiles: A, B, C and D:
A | 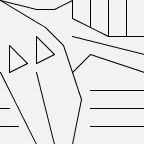 |
B | 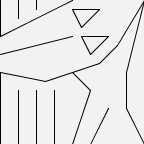 |
C | 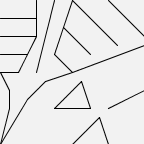 |
D | 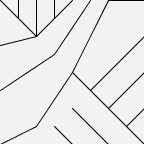 |
These tiles fit together to make a larger tile that we'll call T:
define T = (A $ B) & (C $ D) | 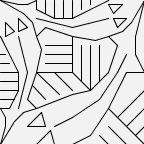 |
It's also possible to fit together four rotated copies of tile A to make another tile that we'll call U:
define U = (A $ rot3(A)) & (rot(A) $ rot2(A)) | 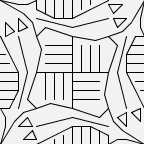 |
As you can see, tile U forms the centre of the Escher
picture.
The important thing about tile T is that it fits next
to a smaller copy of itself, as is shown here:
(T & blank) $ T | 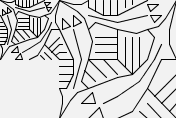 |
In this picture, the blank square forces the copy of T shown on the left to be half the size of the one on the
right, but the tiles still fit together nicely.
It's also possible to fit a small, rotated copy of T
next to T, like this:
(blank & rot(T)) $ T | 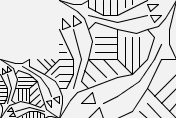 |
In fact, all three copies of T can be fitted together
at once:
define p = (T & rot(T)) $ T | 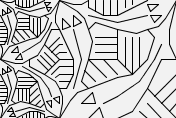 |
What's more, the same trick can be played with a rotated copy of T on the right:
define q = (T & rot(T)) $ rot(T) | 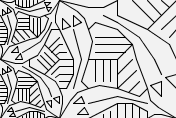 |
And the pictures p and q fit together
vertically:
p & q | 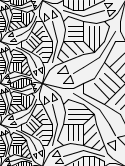 |
It's a remarkable aspect of Escher's genius that he was able to design a tile that works like this.
Now is a good time to introduce a trick that allows us to get
colour pictures. GeomLab has been set up so that it can colour in any
picture made up from the tiles A, B, C and D, choosing the colour of each fish
according to the direction it is pointing. Try typing
colour(p & q) | 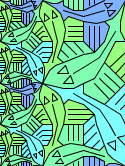 |
to see the previous picture coloured in this way. This picture
looks similar to the part of the Escher picture that is close to the
left-hand edge. This trick can be played with any of the pictures that
are made up of tiles A, B, C
and D -- and the colours help to make it obvious when the
tiles don't fit together properly.
In fact, we can define a sequence of more and more elaborate edge
pieces like this: first, side1 is simply
two copies of T, one of them rotated:
define side1 = T & rot(T) | 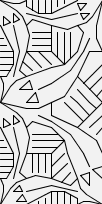 |
Then side2 is obtained by joining two copies of side1 and two copies of T, again
with one rotated:
define side2 = (side1 $ T) & (side1 $ rot(T)) |  |
This is the same as the picture p & q we made
earlier. The next picture in the sequence, side3,
is obtained in a similar way from side2:
define side3 = (side2 $ T) & (side2 $ rot(T)) | 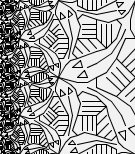 |
To start putting together the Escher picture from these pieces, we
can use a function called frame, defined as follows:
define frame(c, s, p) =
  (c $ rot3(s) $ rot3(c))
  & (s $ p $ rot2(s))
  & (rot(c) $ rot(s) $ rot2(c))
(To save you from typing it out, I've included this definition as
part of GeomLab itself). The idea is that frame(c,
p in the middle, rotated copies of the picture s at the sides, and rotated copies of the picture c in the corners. For example, we could frame the
picture U with copies of man and
star:
frame(star, man, U) | 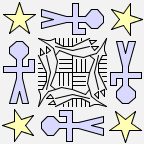 |
For frame to work well, the pictures c and p should be square, but s can be rectangular.
We can use frame to put together Escher pictures like
this, leaving the corners blank for now:
frame(blank, side1, U) | 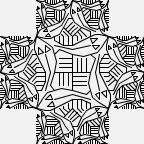 |
frame(blank, side2, U) | 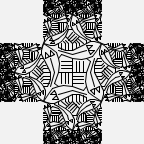 |
frame(blank, side3, U) | 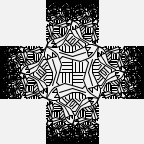 |
So all that remains is to work out what would fill in the gaps at
the corners. For the first picture, copies of U will do:
frame(U, side1, U) | 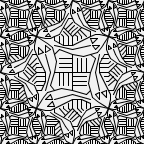 |
To fit with side2 or side3, something
more complicated is needed. If we define
define corner1 = U
define corner2 = (corner1 $ rot3(side1)) & (side1 $ U)
define corner3 = (corner2 $ rot3(side2)) & (side2 $ U)
then these fit perfectly to make the next pictures in Escher's sequence:
define limit2 = frame(corner2, side2, U) | 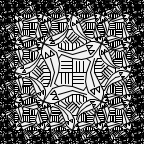 |
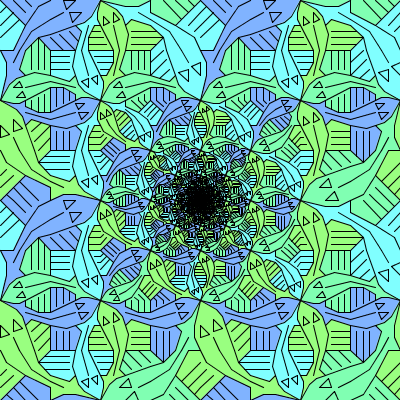
define limit3 = frame(corner3, side3, U) | 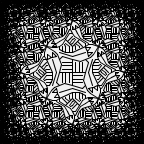 |
You can make colour versions of these pictures by typing (for
example) colour(limit3).
Now two problems for you: first, to define recursive functions
called side(n) and corner(n) so that
the function limit(n), defined by
define limit(n) = frame(corner(n), side(n), U)
can generate the Escher picture to any desired degree of complexity.
Second: work out how to draw this picture, in which the fish get smaller towards the centre.
To do so, you will need two more tiles, E and F:
E | 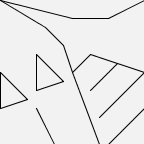 |
F | 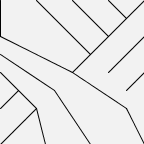 |
Copies of these two tiles fit together to make a pair of fish chasing each other's tails:
define V = (E $ F) & (rot2(F) $ rot2(E)) | 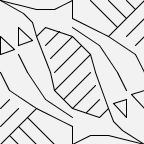 |
These fish appear along the diagonals of the picture. You should
aim to define an `inverse limit' function invlimit(n) that can be used to produce any desired degree of approximation to the picture, replacing the center part with blank.