File Menu

If a menu item in the table below is a hyperlink, click to see examples.
Save Current State  This option allows you to save the entire current session of EigTool as a MATLAB figure, which you can then reload using the MATLAB open command.
Save Current State As...  This allows you to save the entire current session of EigTool under another name.
ExportEigenvalues Save the eigenvalues of the current matrix to a variable in the main MATLAB workspace. You will be prompted for a variable name to use.
 Original Matrix Save the original matrix to a variable in the main MATLAB workspace. You will be prompted for a variable name to use. This is useful if, for example, you call EigTool from within a script and later want to access the matrix, or create the matrix on-the-fly using the New Matrix button.
 Pseudospectra Data Save the pseudospectra data (vectors x and y defining the grid, and the singular value data) to variables in the main MATLAB workspace. You will be prompted for the variable names to use.
 Schur Factor Save the triangular Schur factor of the current matrix to the main MATLAB workspace. You will be prompted for a variable names to use.
Printable Plot...  Create a duplicate figure of the eigenvalues and pseudospectra without any of EigTool's buttons or controls. You will be prompted for a figure number that should be left blank in most cases; a new figure will then be created. If you wish to superimpose the pseudospectra onto an existing plot, you can enter the figure number to use here (ensuring that hold on has been set first).
Quit  Exit EigTool.

Some specific examples

Printable Plot...

In the following example, we first describe how the Printable Plot option works, and then show how it can be used to superimpose eigenvalues and pseudospectra onto an existing plot. The matrix we use is the Grcar matrix of dimension 100 (available through the
Demos menu), and we begin with EigTool as follows:

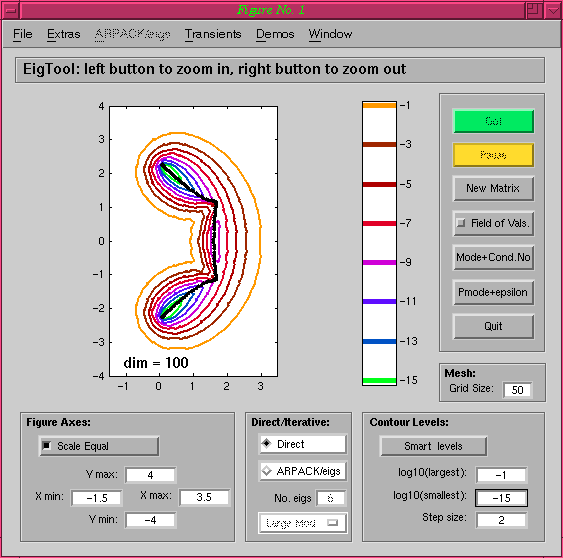
EigTool and Grcar(100)

Selecting Printable Plot and clicking on the OK button (without entering any text) leaves us with the following figure:
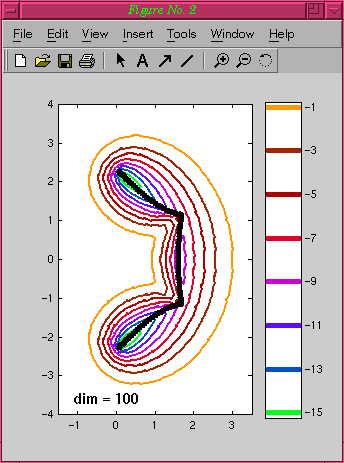
Printable Plot of Grcar(100)

If instead of just removing EigTool's buttons we want to add the EigTool plot to another figure, we simply enter the number of the figure (in this case 2) into the text box when prompted by Printable Plot. Note that we must first ensure that hold on has been set, or the figure contents will be overwritten. The figure below contains the spectrum of the corresponding infinite dimensional Grcar matrix, the entire grey region:
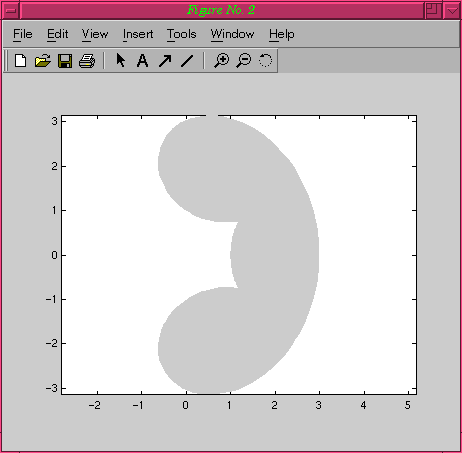
Spectrum of the infinite dimensional Grcar matrix

Here is the output produced by EigTool when the pseudospectra are superimposed on top of it.:
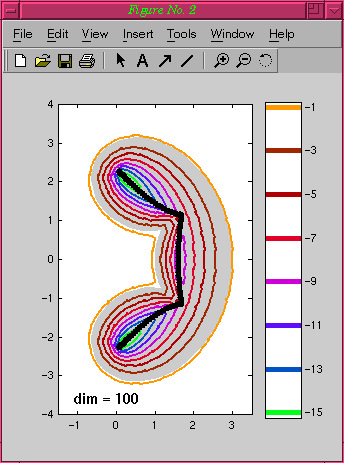
Superimposed Printable Plot of Grcar(100)

Notice how the size and axes for the figure are determined by the EigTool plot, not those that were already being used for the figure.


EigTool home page.