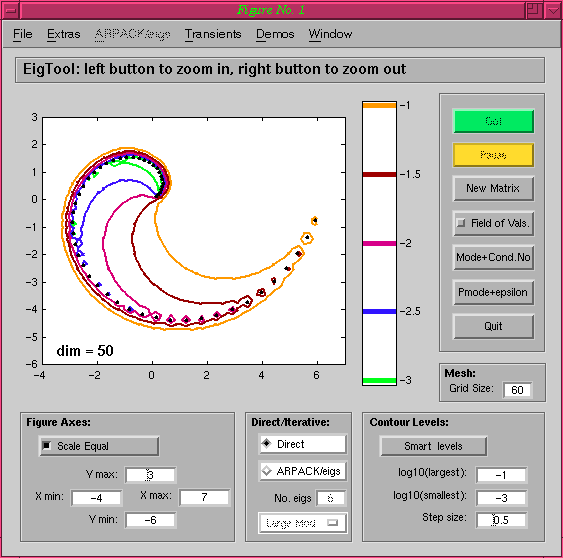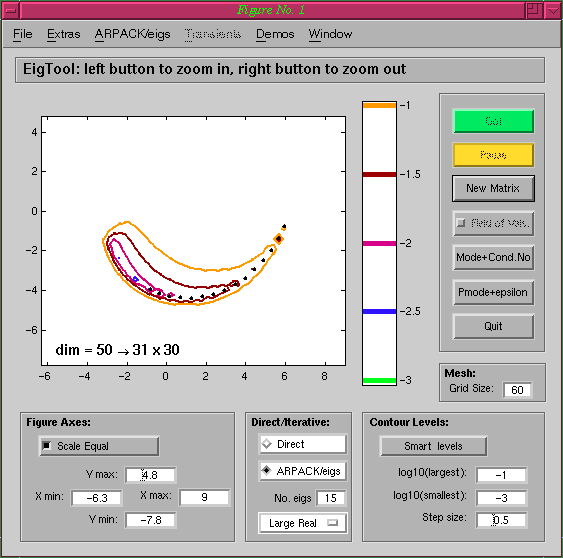

Now, instead of using a (dense) direct method for this 50 by 50 matrix, we can switch to using ARPACK/eigs, and ask for 15 eigenvalues of largest real part:

Notice that when EigTool finishes computing the eigenvalues with
eigs, the pseudospectra based on the rectangular Hessenberg
matrix created during the Arnoldi iteration are plotted. These are
subsets of the true pseudospectra, as can be easily seen here.
Contour Levels
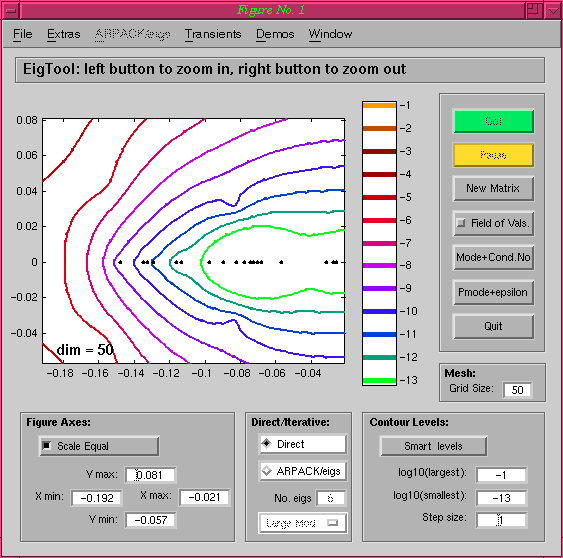
For this example, we first compute the eigenvalues and pseudospectra
of the Random Triangular matrix from the Demos menu, and then zoom in on the
left portion of the spectrum using the mouse. After recomputing the
pseudospectra on this new region of the complex plane, we get the
following figure:

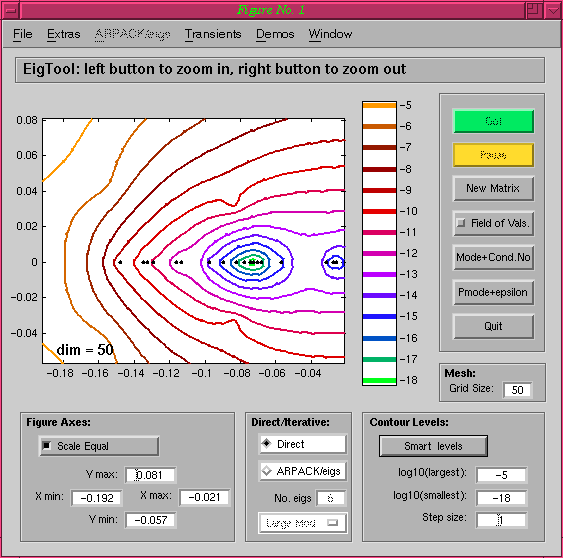
The contour levels we see are the same as those determined by EigTool when the first pseudospectra plot was produced, on the original axes. If we only want to consider levels appropriate to the axes we now have after zooming, we can press the Smart Levels button to allow EigTool to choose the appropriate levels for us:

The levels displayed using Smart Levels are determined by looking at the range of singular values computed on the current grid and the size of the current axes.
EigTool home page.