Home | Introduction | Software | Examples | History | People | Bibliography | Applications | Theorems

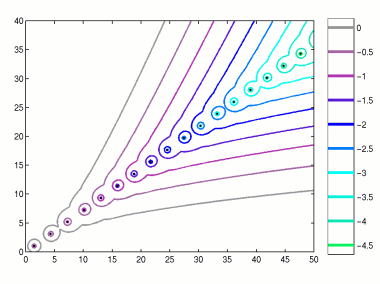
Pseudospectra of a Spectral Approximation of an Anharmonic Oscillator
This figure illustrates pseudospectra of an anharmonic oscillator, -uxx + cx2u, for c=1+3i. The figure above was obtained from a spectral approximation of dimension N=69. Since this discretization includes numerous spurious eigenvalues, the matrix was then projected onto an appropriate invariant subspace to accelerate computation of the pseudospectra. This example was first studied by Davies [Dav99a], [Dav00b]. Use the following MATLAB code compute a similar image using EigTool. N = 70; [D,x] = cheb(N); % cheb.m from Trefethen's "Spectral Methods in MATLAB" x = x(2:N); L = 6; x = L*x; D = D/L; % rescale to [-L,L] A = -D^2; A = A(2:N,2:N) + (1+3i)*diag(x.^2); opts.npts=50; opts.ax = [0 50 0 40]; opts.levels = -10:.5:0; opts.proj_lev = .7; eigtool(A,opts)Download this code: davahosc.m. Download cheb.m from L. N. Trefethen, Spectral Methods in MATLAB, SIAM, Philadelphia, 2000. See also program p24.m in
L. N. Trefethen, Spectral Methods in MATLAB, SIAM, Philadelphia, 2000.
|