| [ < ] | [ > ] | [ << ] | [ Up ] | [ >> ] | [Top] | [Contents] | [Index] | [ ? ] |
This section is intended to guide you, the user, through a typical series of interactions with the tool, exploring variants of the system described above (see section Multiplexed buffer example). The experiments are relatively small, compared with the full capabilities of the tool, and should take no more than an hour or so to complete in total. It is recommended that you see section Using FDR for a description of the position of the controls of the tool.
| 3.2.1 Environment | ||
| 3.2.2 Getting started | ||
| 3.2.3 Debugging |
| [ < ] | [ > ] | [ << ] | [ Up ] | [ >> ] | [Top] | [Contents] | [Index] | [ ? ] |
The system is currently implemented to run under the X Window System, Version 11, and you must be using a console or monitor running X11 or a compatible windowing system.
FDR insists on one variable being set in its environment:
FDRHOME must be set to the (fully qualified) name of the
directory containing the FDR ‘LICENCE’ file, typically the root
directory of the FDR installation. If this variable is not set, the
tool will terminate immediately with an error.
Other environment variables may be set, to select preferred editors and web browsers.
FDREDIT may contain the name of the
editor you prefer to invoke to view script files.
If this is not set, then the environment variables VISUAL and
EDITOR are examined (in that order) and if none of these is set
the editor vi is selected.
In all of the above cases, an X terminal application is launched to host
the editor (so the program xterm needs to be found along your
search path); if your chosen editor opens its own X-window (like
xedit and modern versions of Emacs), then supply its name in the
environment variable FDRXEDIT instead, which overrides the other
variables and launches the editor without the extra terminal
application.
FDRBROWSER environment variable, if set, determines which
browser to use to view the hypertext version of the manual. The browser
is assumed to be an X11 application and will be launched directly,
rather than inside an xterm. If FDRBROWSER is not set, a
simple browser written in Tcl/Tk will be used.
Other environment variables allow you to control the location of various components of FDR, and to control its paging strategies. These are documented in Configuration.
| [ < ] | [ > ] | [ << ] | [ Up ] | [ >> ] | [Top] | [Contents] | [Index] | [ ? ] |
This section should help to give you a first taste of using FDR, by leading you slowly through a simple example. The example deals with multiplexing of multiple streams of data down a single channel, using a second channel for returning acknowledgements. You will need the CSP script called ‘mbuff.csp’, which may be found in the ‘demo’ directory supplied with FDR. (A printed version of that script can found in Multiplexed Buffer Script.)
To invoke FDR2, type at the command prompt
fdr2 |
and wait a short period for the appearance of the main FDR window (see Figure 3 in The Main Window). It is often useful to also have FDR’s status window open, especially when trying out a new script, because the status window will show parsing and compilation errors. You won’t really need it for this example, but open it anyway:
Click Mouse-1 on the Options button, move the pointer over Show status and click again.
You now have two windows. Move them around by dragging their title bars until you find nice positions for them; if they have to overlap, have the main window to the front. You will make most subsequent input via the main window.
Next we need to have FDR load the script ‘mbuff.csp’. To do this
Click Mouse-1 on the File button, move the pointer over Load and click again.
The file selection window (see Figure 4 in The Load command) will then appear. The window has two main areas, the one to the right for moving up and down the directory tree, and the one to the left for selecting a particular file. If, when you invoked FDR, you had the correct current directory then you will see the file name ‘mbuff.csp’ listed in the left-hand area, although to make the name visible you may need to drag a slider that appears to the right of that area when there are too many names for the space provided. If ‘mbuff.csp’ does not appear in the list then you can go searching through the directory tree (for the ‘demo/misc’ directory) by double-clicking Mouse-1 on the folder icons. When you’ve found it, have FDR load it:
Click Mouse-1 on the file name, and then click on Ok.
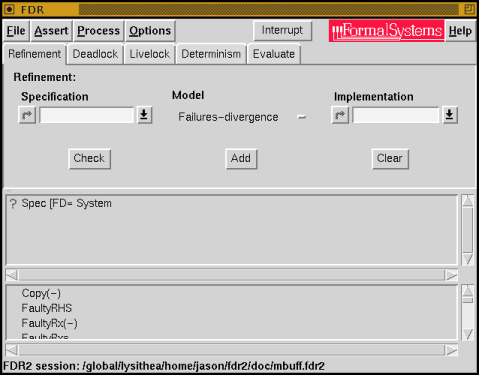
The file selection window will disappear, and after a short delay new information will appear within the main window: an assertion will appear in the Assertion List (just below the Tab Pane) and a list of processes in the area below that, exactly as in Figure 5.
Figure 5: Main Window after Loading mbuff.csp
The assertion was chosen by the writer of the script as the natural refinement check to perform. Notice there is currently a question mark (?) symbol against it. This is because FDR has not yet established whether the assertion holds, so the next thing to do is ask FDR to check the assertion; this is FDR’s main function:
Click Mouse-3 on the assertion, to produce a small action menu, and from this menu select Run with Mouse-1.
Alternatively, a faster way is just to double-click on the assertion. You will notice the question mark against the assertion change to a clock symbol, informing you that FDR has started working on the problem. You will also notice output appearing in the status window, which you will find very useful as you gain experience with FDR; for now simply view it as reassurance of progress being made.
After a short period FDR will complete the check. You will notice the clock symbol against the assertion change to a tick. That tells you that FDR found the assertion to be correct, in this case showing that a combination of transmitters and receivers communicating through a pair of wires behaves like several independent one-place buffers. There is nothing more you can do with this assertion: it doesn’t make sense to ask FDR why the implementation works…
| [ < ] | [ > ] | [ << ] | [ Up ] | [ >> ] | [Top] | [Contents] | [Index] | [ ? ] |
There is a broken version of the system defined in the same file; you can use it to try out FDR’s debugging capabilities. For the broken version a corresponding assertion could have been inserted in the file, which would have popped up with the other assertion in the Assertion List. We would then have needed simply to select that and start a second check. But since no such assertion appears in the file, we must build one using the Tab Pane (just below the Tab Bar). First you need to select the specification process:
Drag the process-list slider so as to make the process name Spec visible, click Mouse-1 on the name to select it, and then click on the arrow button below the word Specification, which can be found towards the left of the Tab Pane.
You will see the name Spec appear in the text gadget just to the right of the arrow button. Actually you could have clicked in the text gadget and typed in Spec directly, but the way you just did it is usually quicker unless you wish to choose as the specification an expression that hasn’t been given a name within the script.
You also need to choose the broken system as the implementation:
Drag the process-list slider so as to make the process name FaultySystem visible, click Mouse-1 on the name to select it, and then click on the arrow button below the word Implementation, which can be found towards the right of the Tab Pane.
Now you have chosen the two processes that you wish FDR to compare, you should start the check:
Click Mouse-1 on the Check button.
You will see the new assertion appear below the one you have already checked. The new assertion will have a clock symbol to its left, showing that FDR is now working on the problem. After a short wait and a little more output from the status window, you will see the clock symbol change to a cross, telling you that FDR has found that this version of the system does not satisfy the specification. This is more interesting than the previous, successful check because you can now ask FDR to show why the refinement fails: FDR2 can show you a particular way the implementation can behave that isn’t allowed by the specification, and also show how each part of the implementation plays a part in producing the unacceptable behaviour.
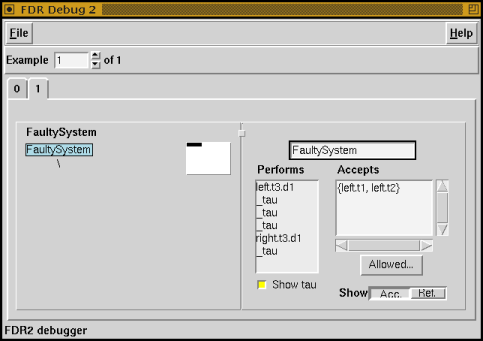
Figure 6: Debugging Window
The first step in doing this is to bring up a debugging window (shown in Figure 6):
Click over the failed assertion with Mouse-3, to produce a small action menu, and from this menu select Debug by clicking Mouse-1.
On the left side of the debugging window that has just appeared is an area for displaying the processes being checked (the implementation rather than the specification, by default). At the moment this area just contains the name of the process (FaultySystem) with a ‘\’ below it. The ‘\’ tells you that the outermost operator in the description of FaultySystem is hiding. You can expand the display of this process to see the subprocesses from which it is built, arranged in a tree-like structure:
Hold down the <Ctrl> key and double-click Mouse-1 over FaultySystem.
You can now see the tree fully expanded, although only part of it is visible in the window. You can move around the tree by using the Panning Control in the top right of the view of the process tree. The larger, grey rectangle represents the entire area of the tree, whereas the smaller white rectangle represents the displayed area. View the root of the tree:
Drag the white rectangle with Mouse-1 so that it is horizontally centred and as high as possible within the grey rectangle.
You will see that the root is still selected (highlighted in blue), which assures you that the other information in the debugging window applies to the process as a whole. That other information, displayed in the central and right-hand areas of the debugging window, is the behaviour that FDR has found to be exhibited by FaultySystem, although not by Spec.
In this case, it is a failure of liveness, which you can tell by the right-hand area having the heading Accepts. Such a behaviour consists of a perfectly acceptable trace of events performed by FaultySystem and an unacceptably small set of events that FaultySystem may then offer to its environment. The trace is displayed in the central part of the debugging window, headed Performs. Read it from top to bottom:
The _tau’s can get in the way when there are many of them, in which case they can be removed by clicking with Mouse-1 on the Show tau button, below the displayed trace. In this example it is better to leave them visible.
Looking now at the right-hand area of the debugging window you can see a set of events that FaultySystem may offer to its environment after performing the above trace. The display shows a set containing left.t1 and left.t2. Actually both of these are channels rather than events; FDR’s convention when displaying sets of events is to use a channel to represent the set of all events that can be passed on that channel, so in this case the fully expanded set of events would have members left.t1.d1, left.t1.d2, left.t2.d1 and left.t2.d2. The form displayed is more concise, which is especially important when there are a lot of events in an acceptance.
You might not immediately see what is wrong with this set of events being offered, but you can ask FDR to show you which sets Spec might offer after performing the same trace:
Click Mouse-1 on the Allowed... button, which is just below the area where the sets of acceptances are displayed.
A new window (as shown in Figure 7) appears showing in its top half the set of events offered by System, and in its bottom half the sets of events that Spec might offer. In this example, there is no non-determinism in the behaviour of Spec and so there is only one set displayed in the bottom half of the window, which Spec is therefore guaranteed to offer. Again notice the use of FDR’s channel convention in displaying the set: what looks to be a single member left, actually stands for all events passable by the channel left, which are left.t1.d1, left.t1.d2, left.t2.d1, left.t2.d2, left.t3.d1 and left.t3.d2. In particular, notice that Spec is offering left.t3.d1 and left.t3.d2, whereas FaultySystem is not. Now we can state precisely the nature of the failure: after passing one data item between the transmitter and receiver labelled t3, that transmitter is not willing to input a second value, although in the same circumstances Spec would.
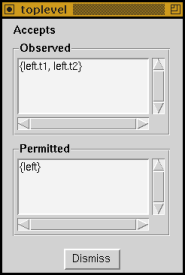
Figure 7: Acceptances Comparison Window
Another aid to interpreting the behaviour is to display what FaultySystem is refusing rather than what it is accepting. First get rid of the most recently opened window:
Click Mouse-1 on the Dismiss button at the bottom of that window.
Then view the refusal set:
Click Mouse-1 on the Ref. button, at the bottom right of the debugging window.
You will see the heading of the right-hand display area change from Accepts to Refuses, and the set being displayed change to right, left.t3, showing that out of all events that FaultySystem might perform, it can refuse to output any value on the right channels, and can refuse to input on the left channel labelled t3. Seeing as the trace of events performed shows that all items that have been input have also been output, it is quite reasonable for right to be refused, but the refusal of left.t3 stands out as an anomaly.
Now we know the nature of the failure, we will look at the subprocesses of FaultySystem to locate the cause. It will be easier to go back to working with acceptance sets rather than refusals:
Click Mouse-1 on the Acc. button at the bottom left of the debugging window.
You can view a subprocess’s part in producing the incorrect behaviour, by simply clicking on its node in the tree (displayed to the left of the debugging window). Below the root of the tree there is a node labelled ‘[|...|]’. This denotes the parallel composition of the two nodes that lie below it, and is the next operator in from the hiding mentioned earlier. Keep an eye on the trace displayed in the central part of the debugging window, and move to that node:
Click Mouse-1 in the left-hand area, over the ‘[|...|]’ node.
You will notice just one change in the displayed behaviour, which is that one of the _tau’s changes to mess.t3.d1. This is because by clicking on the ‘[|...|]’ node you are looking within the hiding of the channel mess, thus exposing the true event that gave rise to the _tau. That in itself doesn’t really help you here, but it should give you an idea of how information can be gained by moving around the tree.
Now let’s look for the fault more systematically. The datum was passed between the transmitter and receiver labelled t3, so looking at the line of communication between those might be a good start.
Pan the tree display to the bottom left-hand corner, and click Mouse-1 on Tx(t3).
You can see that Tx(t3) performs left.t3.d1 (inputing a datum), performs snd_mess.t3.d1 (requesting that the tagged datum be sent along the transmission medium), and is then determined to accept an acknowledgement rcv_ack.t3. This is quite reasonable behaviour: it is not supposed to accept another input until receiving an acknowledgement. Now look at the process that receives the request to send the datum.
Click Mouse-1 on the node of the tree labelled SndMess.
You can see that SndMess performs snd_mess.t3.d1 (receiving a request to send the tagged datum), performs mess.t3.d1 (the actual transmission of the datum), and is then ready to accept the next request. Again, nothing wrong here: acknowledgements are not SndMess’s concern. Now look at the process that picks up acknowledgements from the transmission medium — the process that should have passed on an acknowledgement to Tx(t3).
Pan your view of the process tree slightly to the right (if necessary), so as to make the node labelled RcvAck visible, and then click Mouse-1 over it.
Notice that RcvAck has not done anything (denoted by the trace list containing just the words “Empty Trace”), although it is willing to accept an acknowledgement from the transmission medium, just as it is supposed to. Thus, this process can not be blamed either. If you pan to the very right of the tree you can check out the processes that lie at the other end of the transmission medium, those labelled RcvMess and SndAck, but you will find correct behaviour there also. This leaves just FaultyRx(t3) to check (and the name rather gives things away!).
Click Mouse-1 over the node labelled FaultyRx(t3).
You can see that FaultyRx(t3) performs rcv_mess.t3.d1 (receiving an appropriately tagged datum from the process RcvMess), performs right.t3.d1 (sending the datum), and is then willing to accept another tagged datum, but is not willing to produce an acknowledgement. This is the cause of failure: it is necessary that FaultyRx(t3) sends an acknowledgement back through the medium, to tell Tx(t3) it may input another datum.
This concludes the tutorial. You might feel that the example was slightly artificial, especially as the subprocess we were looking for was clearly labelled Faulty, but in fact the way of working we have just covered is very much what one does when using FDR on real design problems. Often, of course, the systems are very much larger, sometimes with numbers of states running into tens of millions, but often also the crux of a problem can be found with process descriptions of the size shown in this example.
| [ < ] | [ > ] | [ << ] | [ Up ] | [ >> ] |
This document was generated by Phil Armstrong on May 17, 2012 using texi2html 1.82.