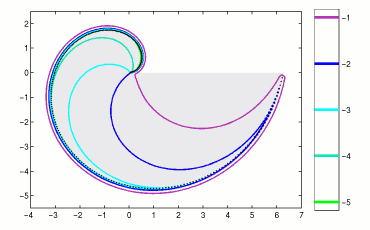
Pseudospectra of a Toeplitz Matrix with a Piecewise Continuous Symbol
Dimension N=250

The colored lines denote the boundaries of pseudospectra of a Toeplitz matrix
of dimension N=250 with a piecewise continuous symbol. The gray region shows the
spectrum of the infinite dimensional Toeplitz operator on l2(N).
For N sufficiently large, each of the illustrated pseudospectra will
include the spectrum of the infinite dimensional operator, but for this class of
piecewise continuous symbols, this value of N needs to be especially large.
The eigenvalues of this example have been studied by Basor and Morrison
("The Fisher-Hartwig conjecture and Toeplitz eigenvalues", Linear
Algebra Appl. 202 (1994), 129-142); pseudospectra are illustrated in
[BET00].
Further details about this example can be found on the page:
Pseudospectra of Toeplitz Matrices and Operators:
Matrices with Piecewise Continuous Symbols.
Use the following MATLAB code compute pseudospectra for this example using
EigTool.
Note that the above plot would use N=250 below.
    N = 50;
    r = -i./[1:N]; c = [-i pi i./[1:N-2]];
    T = toeplitz(c,r);
    opts.npts = 50;
    opts.ax = [-4 7 -6 3];
    opts.levels = [-5:-1];
    eigtool(T, opts)
Download this code: snail.m.
| 
