
TransIt
Automatically create transition diagrams of CSP processes.
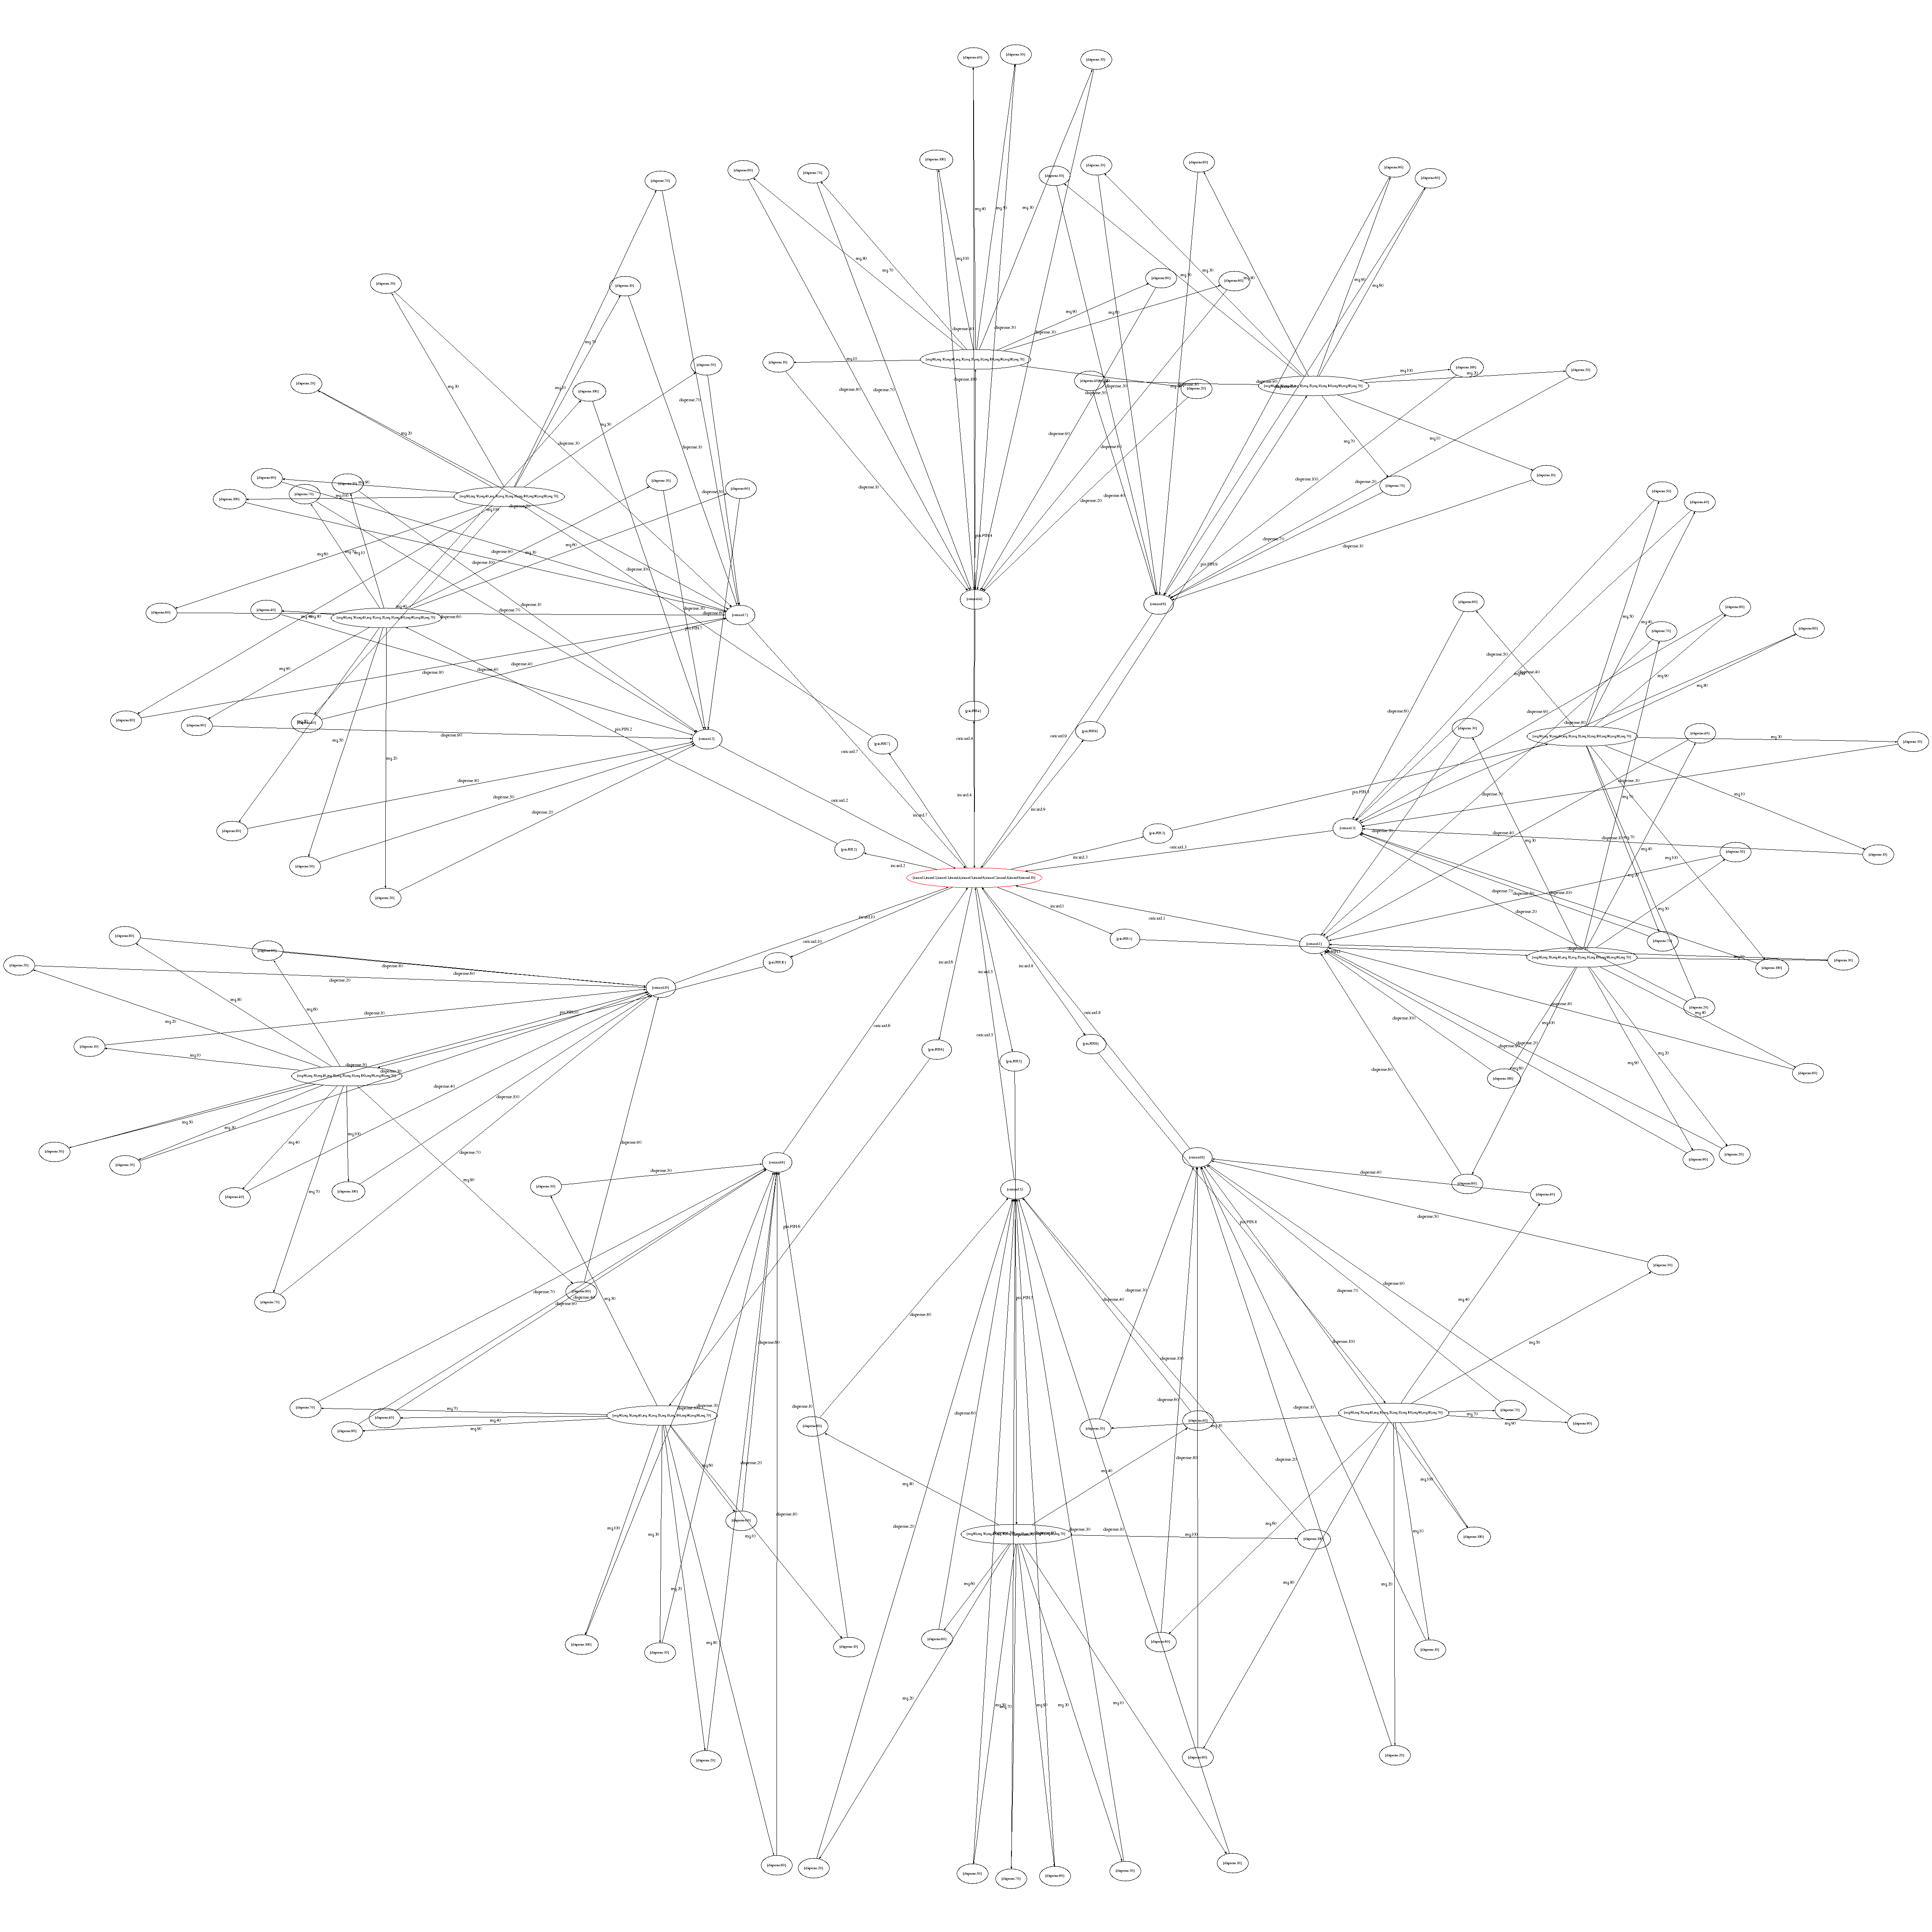
(click the image for the original which is larger)
The image above shows the transition diagram of the process ATM1 defined in section2-1.csp. The process has been normalized and each node has been labelled with its acceptances. It was generated by TransIt using the following invocation:
transit -na section2-1.csp ATM1 output.png png -Goverlap=orthoxy \
               -Gratio=1.0
TransIt supports all output formats supported by GraphViz, including PNG (shown above), PostScript, SVG and XFig, among many others.
ChangeLog
Version 0.2 - August 8 2008
- Allow nodes to be annotated with acceptance and divergence information via the '-a' and '-d' options respectively.
- Allow processes to be normalised using the '-n' option.
- Allow intermediate temporary output files to be preserved using the '-p' option.
Version 0.1 - February 9 2007
Initial release.
Download
Download - Version 0.2c, September 4 2008
Dependencies
- FDR2 - known to work with FDR 2.82
- GraphViz - know to work with GraphViz 2.6
- Python - known to work with Python 2.4
- GNU Bash - known to work with GNU Bash 2.02
Usage
See the included README for detailed instructions, including the Troubleshooting section for advice on how to optimise the layout of transition diagrams for complicated processes.
Feedback
Please send me bug reports, comments and general feedback.